01 / the idea
The idea.
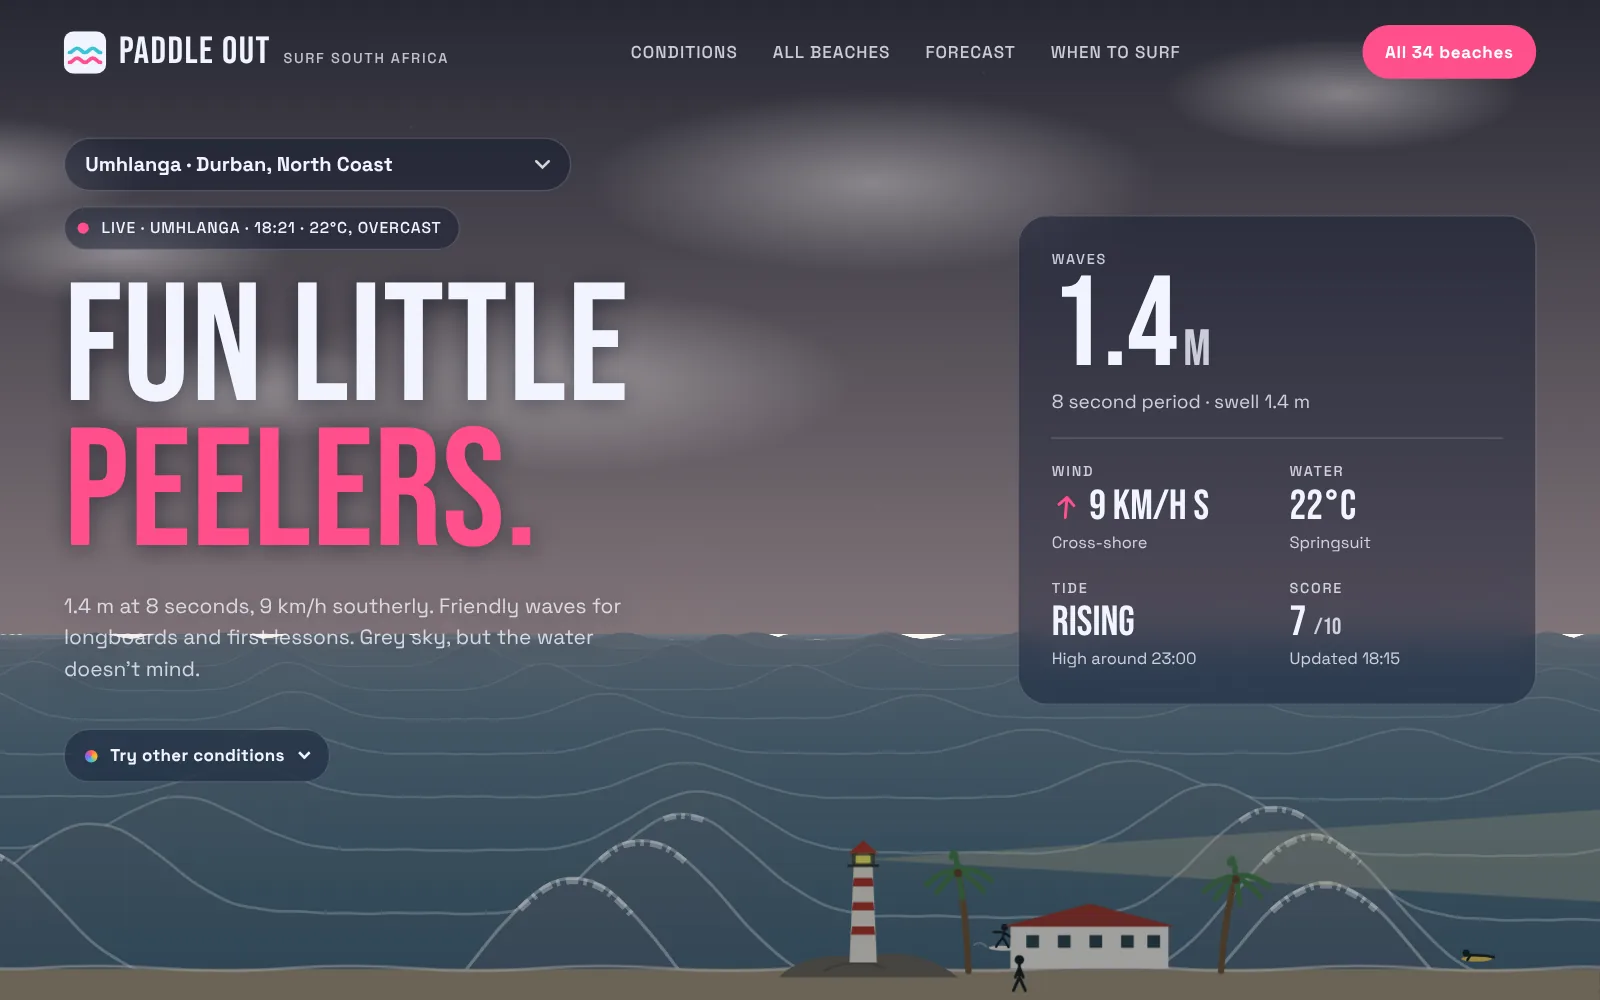
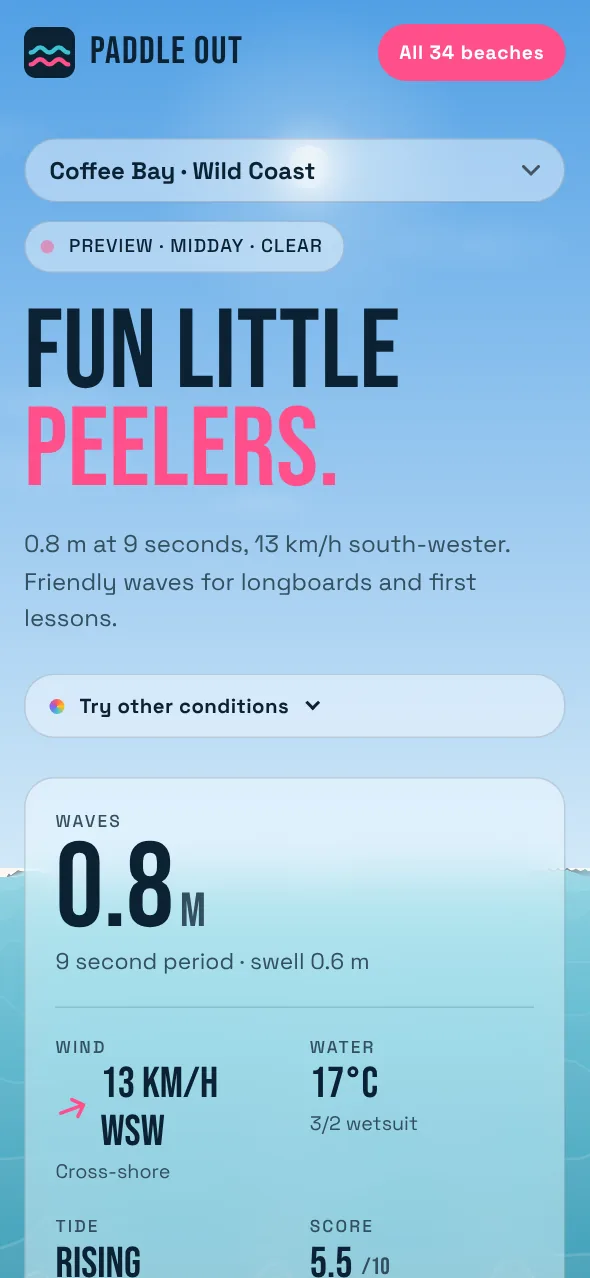
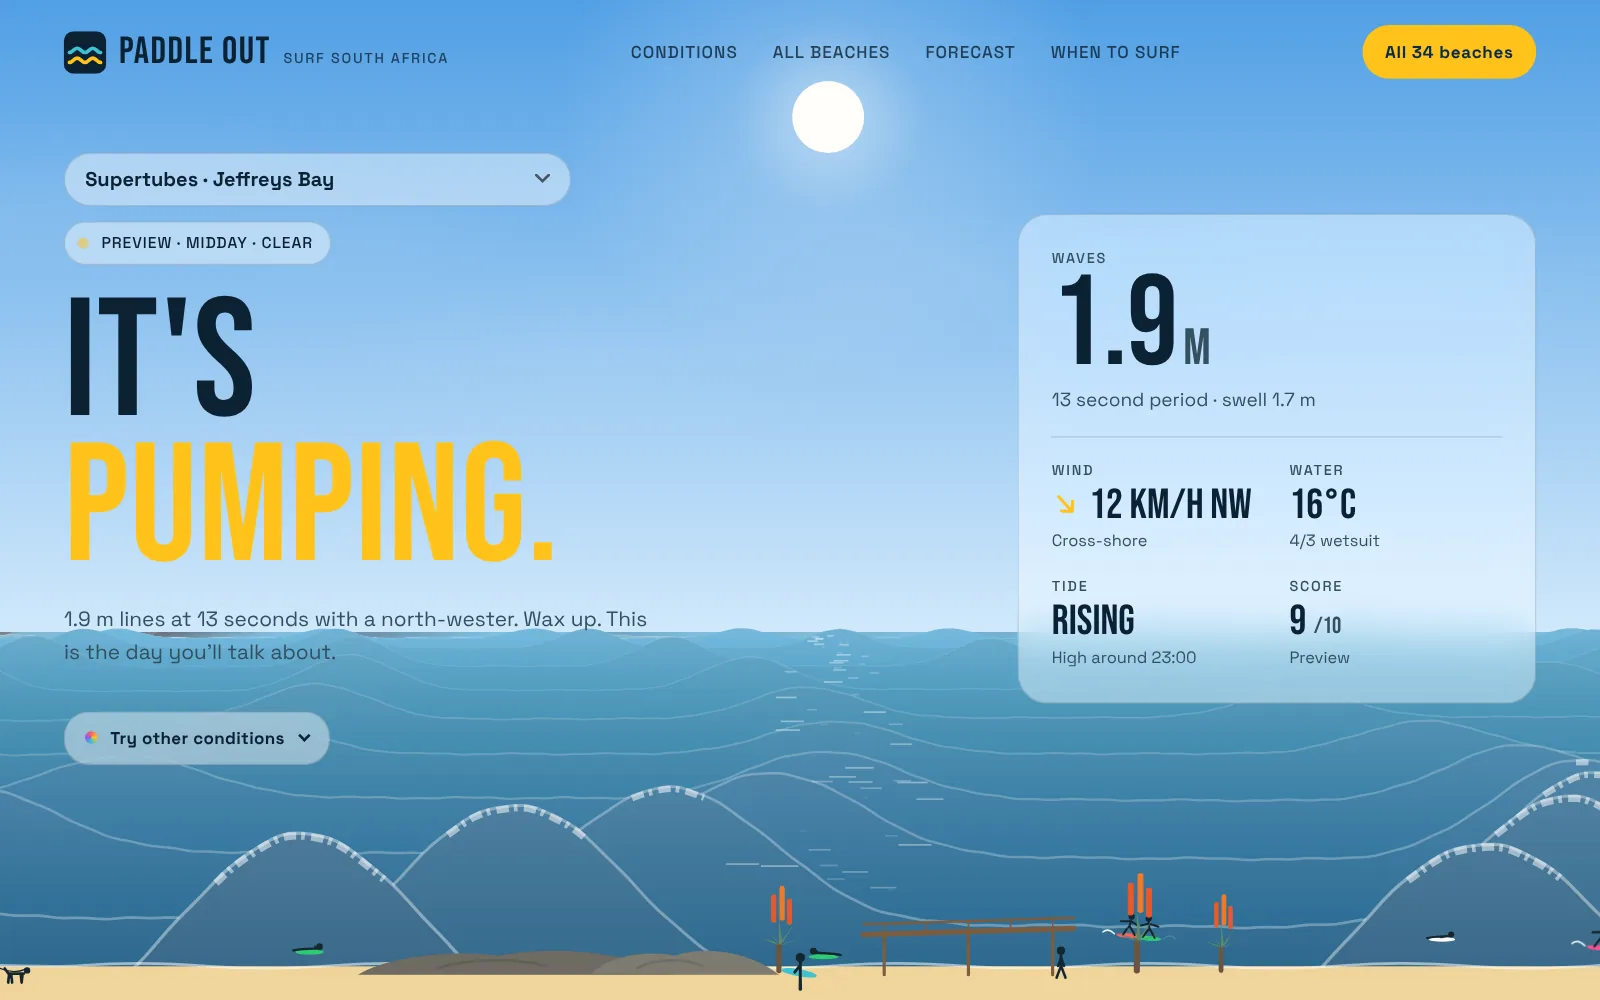
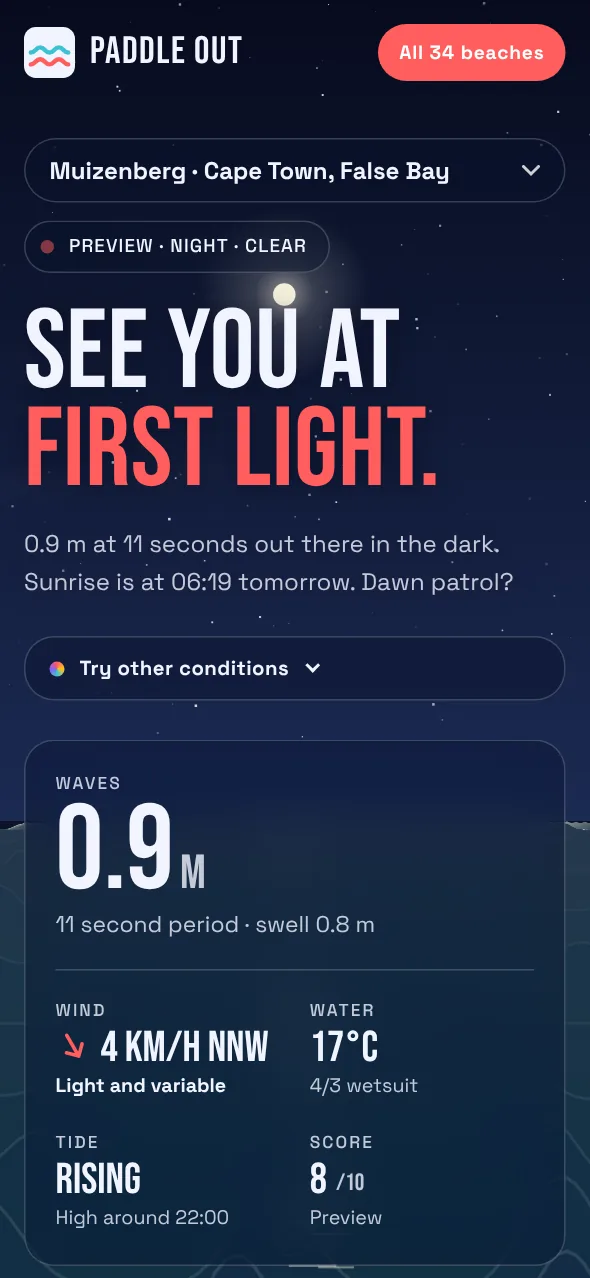
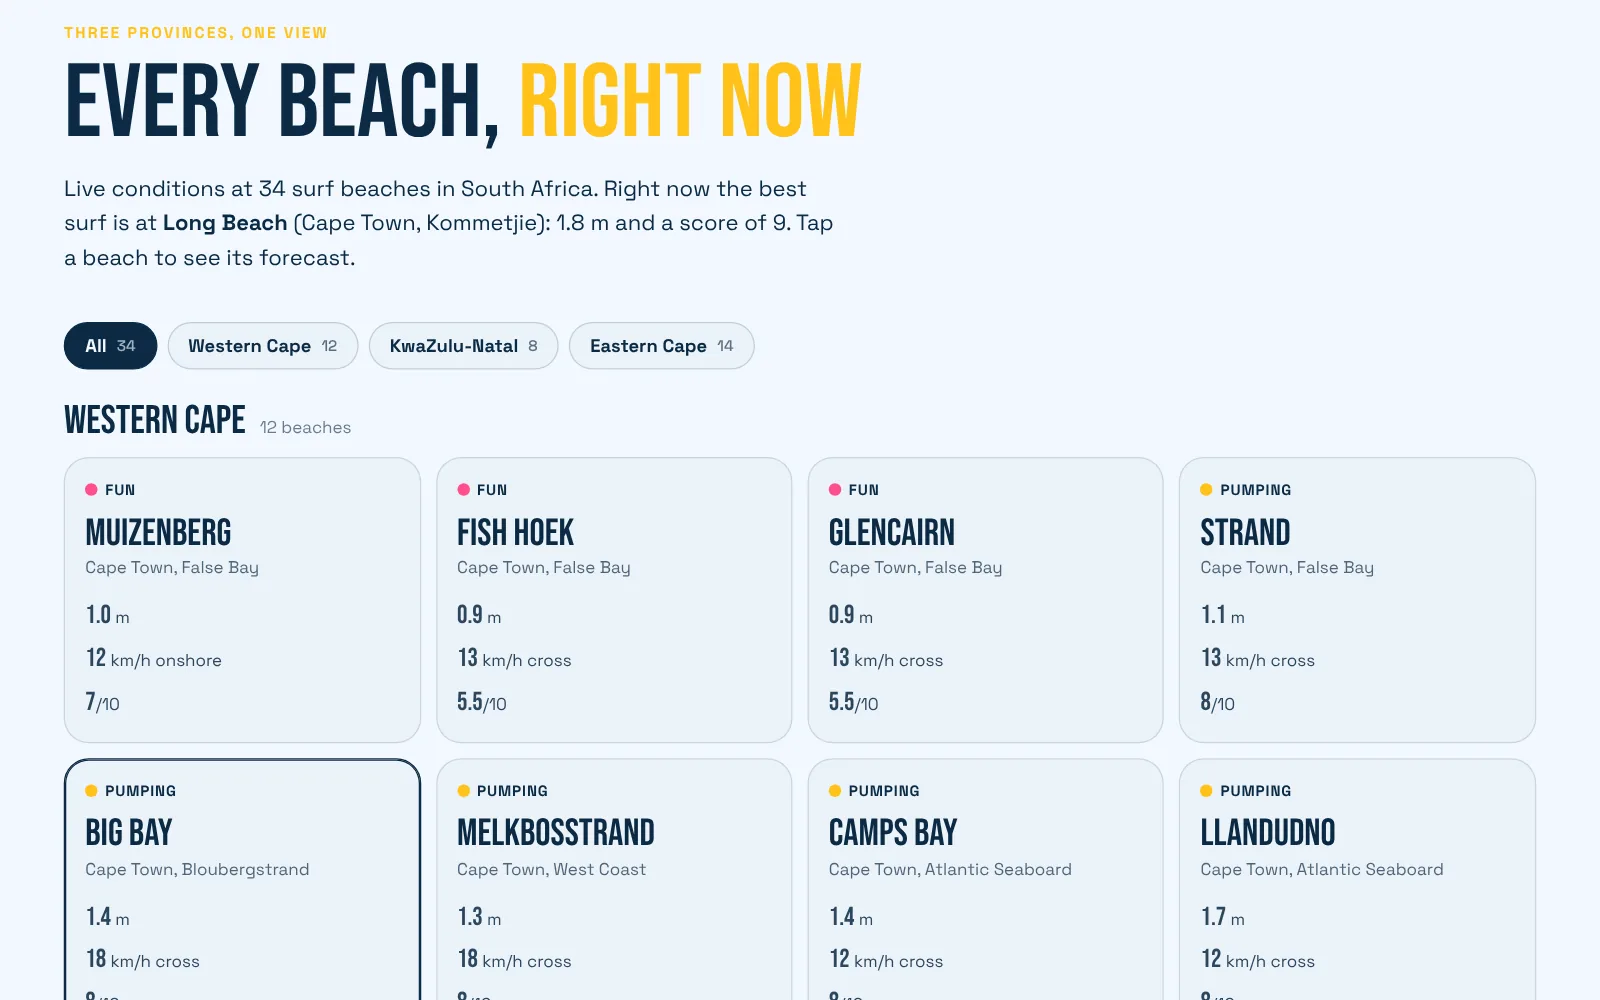
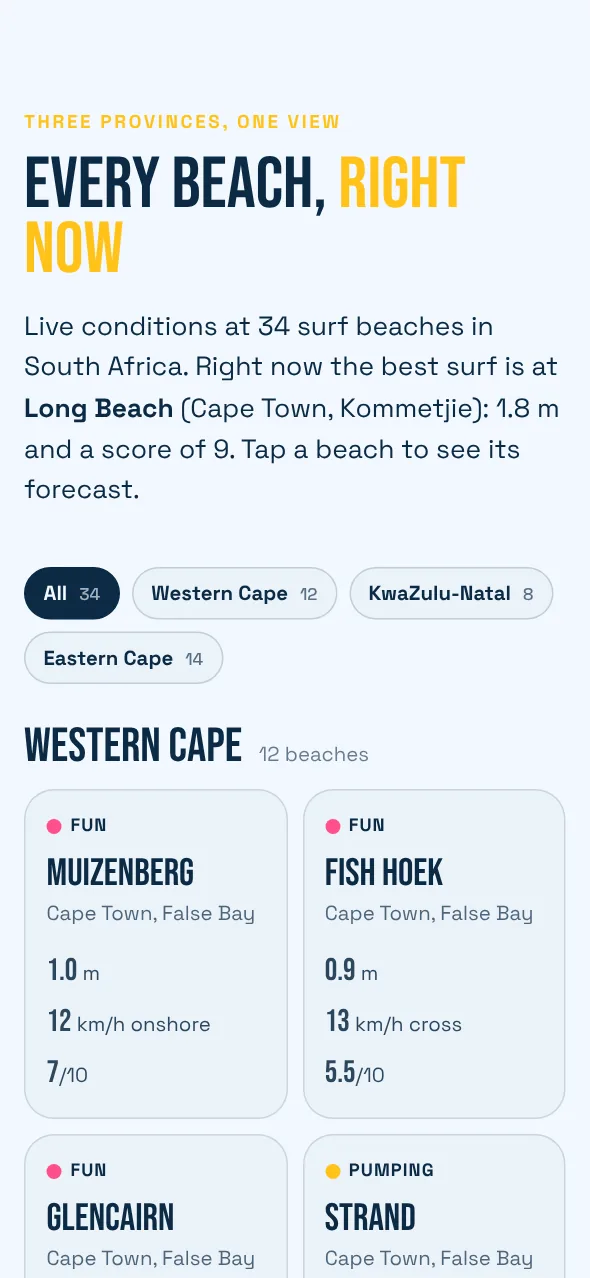
Most surf reports are tables. This one tries to look like the beach. Pick a spot and the page becomes it: the headline, the sea, the sky and the colours all change to match what the water is doing right now.
Every beach is drawn with something a local would recognise. Table Mountain behind Big Bay, the striped lighthouse at Umhlanga, the Hole in the Wall at Coffee Bay, the huts at Muizenberg. Stick figures fill the sand on a sunny day, thin out when the wind picks up and go home when it rains or gets dark.
The beaches are grouped by province, so a surfer in Durban can see the whole coast from Ballito to Scottburgh in one tap and compare it with the Cape or the Eastern Cape.
02 / the build
The build.
A single server function fetches wave height, swell period, wind, water temperature and tide for all 34 beaches in one request, then caches the result for twenty minutes. Visitors never call the data provider directly, so the site stays fast and the API key stays private.
Each beach knows which way it faces, so the scoring treats an offshore wind as clean and an onshore wind as messy. The forecast grid is about 8 km wide, so a sheltered bay and an exposed point can share a forecast point. An exposure factor for each beach keeps sheltered spots smaller than the open coast next door.
The sea is drawn in code on every frame, the sky follows the real sunrise and sunset, and on phones the scene shifts so each landmark stays in view. A three-day chart finds the best window to paddle out, and if the live feed is down the site says so and shows sample data.